 Using Real Time Plot
 Using Real Time Plot
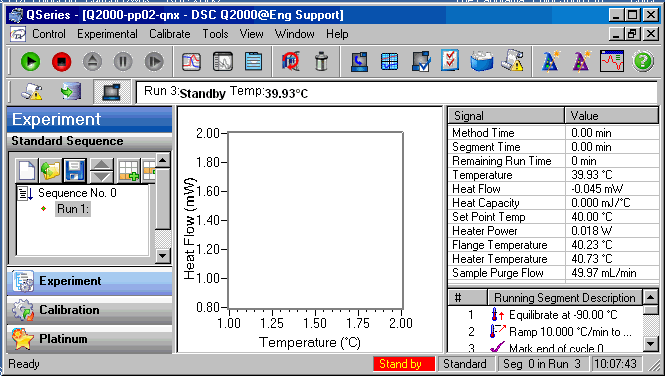
The RealTime Plot pane is used to display the data obtained from the instrument as it is collected. You can select the signals to be plots, configure the plot, choose the way you want to display the plot within your instrument control window, and start and stop the plot as desired.
Select from the following topics for more information:
 Choosing
Real Time Signals to Plot
 Viewing
the Real Time Plot Pane
 Customizing
the Real Time Plot Settings


There are two ways to start the Real Time Plot:
Automatically: Click Tools/Settings/Restart at Method Start from the main menu or position the cursor within the Real Time Plot pane, right click and select Restart at Method Start from the pop-up menu to start the plot automatically at the beginning of a run.
Manually: Click Tools/RT Plot/Start Plot from the main menu or position the cursor within the Real Time Plot pane, right click and select Start Plot to begin plotting the real-time data from the instrument. The plot will be refreshed as new data is received. If you are plotting data versus time, the time will be reset to zero.
To display the Real Time Plot in the main pane of the instrument window, select View/Real Time Plot from the main menu or click the button on the tool bar. The Sequence Pane (if selected in User Preferences), Signal Display Pane, and Running Segment Pane will also be displayed in the instrument window.

To display the Real Time Plot in Full Screen View, select View/Real
Time Plot in Full Screen View or click the  button
on the tool bar.

You can customize the font and background color within the Real Time Plot window and select the plot starting and stopping options by clicking Tools/RT Plot/Settings from the main menu or by positioning the cursor in the Real Time Plot pane and right clicking to display the pop-up menu. then select Settings. Click on the arrow then choose the desired option from the following list:
Font: Use this option to choose the font that will be applied to all of the text in the selected Real Time plot display area. (The Real Time Plot title is associated with the current sample name.)
Background: Use this option to choose the background color for the selected RealTime Plot area. NOTE: To customize the colors used for the axes and their corresponding curves, select Signals from the pop-up menu.
Restart on Method Start: Use this option to start the plot automatically at the beginning of a run.
Stop at Method End: Use the Stop plot at method end option to halt the graph on the RealTime Plot window between methods. At the end of the method, the data curve will stop being drawn. NOTE: Do not select this option if you want to continue to display the data after the experiment is complete.
Select Tools/RT Plot/Print from the main menu or select Print from the pop-up Real Time Plot menu to print the current RT plot data on the default printer.
There are two ways to stop the Real Time Plot:
Automatically: Click Tools/Settings/Stop at Method End from the main menu or position the cursor within the Real Time Plot pane, right click and select Stop at Method End from the pop-up menu to stop the plot automatically at the end of a run.
Manually: Click Tools/RT Plot/Stop Plot from the main menu or position the cursor within the Real Time Plot pane, right click and select Stop Plot to stop plotting the real-time data from the instrument.