 Using the TA Instrument Explorer
 Using the TA Instrument Explorer
The TA Instrument Explorer Window is a customizable graphical user interface for TA Messaging Agent (TAMA). It enables users to setup, view and control any instruments currently connected to the supplied private Ethernet Hub or a Local Area Network (LAN). The TA Instrument Explorer is also used to monitor the status of data transmission from the instrument to any controller via the Data File Acceptor (DFA).
To open the TA Instrument Explorer, double click on the ![]() icon located on your desktop to start the program.
icon located on your desktop to start the program.
Click on the following topics for more information:


To change the language displayed for the TA Instrument Explorer and Instrument Control program follow these steps:
Click the icon in the upper left-hand corner of the TA Instrument Explorer window to display the drop-down menu.
Choose Select Language, then
select one of the three available languages, English,
Deutsch (German),
 (Japanese),
or
  (Chinese).
After you select the language, the program will automatically be displayed
in the chosen language.
Repeat the process to change the language again.
The language used for instrument control is based on the instrument language. To set this language see Updating Software and Downloading a Language.
The TA Instrument Explorer is used to perform the following functions:
Double click on the instrument icon (e.g., ) on the Online Instrument view to connect to a selected instrument and automatically open the instrument control software for that instrument.
Right click on the instrument icon (e.g., ) on the Online Instrument view or right click on an instrument row in the Instrument Information View to connect to the instrument using the pop-up menu.
Right click on the instrument icon (e.g., ) on the Online Instrument view and select Setup Instrument to make changes to the instrument settings such as: synchronize the instruments and PC’s date and time, updating module software, resetting the instruments parameters, and configuring the instrument's network settings.
Click the various icons on the TA Instrument Explorer tool bar to view the status of each instrument, any error information associated with that instrument, or the data file acceptor (DFA) status.
Access the drop-down menu (from the upper left corner icon) and the right click pop-up menu to perform various functions.


The TA Instrument Explorer tool bar is used to access various functions associated with the Explorer window and the instruments online. Click on the name of the item below for more information.
This button is used to view all the instruments currently online. This window displays the Name, Temperature, State and Location for each instrument currently connected to the private Ethernet Switch or LAN.
This button is used to view instrument information. This window displays the Instrument's Name, Location, Model, current version of instrument software installed (Inst. Ver.), Physical Address, Serial No., IP Address, Update Time (and Date), name of controller computer (Master Name), Installed Options, and the number of connections (NOC) for each instrument connected to the private Ethernet Hub or LAN.
 Viewing
the Data File Acceptor (DFA) Status
(Q Series Instruments Only)
Click this button to view the Data File Acceptor (DFA) Status for all instruments. This window displays the status of data transmission from instruments to the controller as well as the Instrument Name, Number of Bytes Received, Data File Acceptor (DFA) State, Time and Date Information Last Updated, IP Address, and the Data File Path for each instrument that is sending data to the controller.
Changing
the TA Instrument Explorer Settings
This button is used to view the settings for the TA Instruments Explorer. This window allows you to customize the appearance of the TA Instruments Explorer based on the options selected. The list of options and their functions are listed below. See Changing the TA Instruments Explorer Settings.
Refreshing
the TA Instrument Explorer
Click this button to immediately refresh all of the information displayed in the TA Instruments Explorer.
This button is used to connect to the specified Internet Home Page address that was set using the TA Instrument Explorer Settings.
Click on the Help button to open an Adobe Acrobat Reader (PDF) file containing information on the TA Instrument Explorer. (NOTE: The contents of that document are similar to this help topic that you are currently viewing.)
Use the two drop-down menus to sort the instruments connected online based on location or instrument type in the TA Instruments Explorer. To display all of the instruments, select All Locations or All Types.
Click the button on the TA Instrument Explorer tool
bar, then click the General
tab to view the settings for the TA Instrument Explorer as shown below:
Follow these instructions to set up the Explorer window.
Check Always on Top, if you want the instrument Explorer window to be displayed on top of any other open window. If left unchecked, the window will be displayed in the regular fashion.
Check Auto Fitting, if you want to automatically adjust each column width so that the items will fit into columns in the Instrument Information view.
Enter the desired refresh time in the Refresh every ___ seconds field, which is the time that will elapse before the TA Instrument Explorer window is updated again with new information.
Check Show Explorer window after start to automatically display the Explorer window every time your computer is started.
Check Add an icon in the System Tray to automatically add an icon for the Explorer to the system tray when the window is open.
Check Disable auto run after login to keep the Explorer from running after logging on to Microsoft Windows.
Check Enable Event Logging for Q Series TAMA to enable the logging of Thermal Q Series TAMA and DFA messages in the event log.
Click the Open System Event Log button to open the System Event Log. This log contains information about hardware, software and system problems.
Click the Export Files button to export the Event and Application Logs to the desktop.
Select a color from the View Color drop-down list to change the background color of the Explorer window.
Check the Use row cursor box to show a highlighted selection bar as you move the cursor up and down the Instrument Information view. This is to allow you to easily see which instrument you are pointing to. Leave the box empty to remove this feature.
Check the Transparent window box to turn the Explorer window transparent when you drag it to a different position on the desktop. Leave the box empty to remove this feature.
Enter a default WWW Home page address for the Internet icon on the tool bar.
Click OK when completed.
When you install the Advantage software (V4.3 or higher) you will have the option of installing the Platinum Mail Messaging Database option. This component creates a localized database on your system to manage all of the messaging requests. If you have multiple controllers, you will only need to install this option once and specify the Messaging Database (Primary TAMADB) on the other controllers.
To find out how to configure the database, you
can open the appropriate Acrobat Reader PDF file by clicking here  Configuring Platinum Mail
& Messaging. for information.
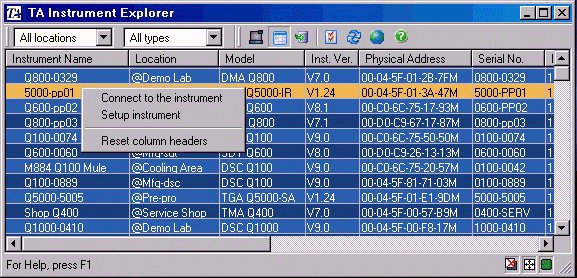
To access the TA Instrument Explorer Pop-up menu, right click on the
instrument icon (e.g., ![]() ) in the Online Instrument View or right click on an instrument
row in the Instrument Information View as shown in the figure below.
) in the Online Instrument View or right click on an instrument
row in the Instrument Information View as shown in the figure below.

Select from one of the following menu options. Click on the name for further information.
Select Connect to the instrument to connect the selected (highlighted) instrument to your computer and automatically open instrument control software for that instrument.
Setup instrument (Q Series Instruments Only)
Select Setup Instrument to make changes to the instrument settings for the selected (highlighted) instrument. This will open the Instrument Setup Wizard dialog that can be used to synchronize the instruments and PC’s Date and Time, Update Module Software, Reset the Instruments Parameters, and Configure the Instruments Network Settings.
Select Reset column headers to reset the columns and their headers to the default positions. This feature is helpful if the columns have been repositioned and no longer display as desired.
To access the TA Instrument Explorer drop-down menu, click on the icon located in the upper left-hand corner of the window. Select from the following menu options. Click on the name for more information on that item.
Used to reset the TA Instruments Explorer window to its previous size and/or position.
Used to reposition the TA Instruments Explorer window. A four-sided arrow is displayed when this function is selected. Hold down the left mouse button and drag the window to the desired position, then release the button.
Used to resize the TA Instruments Explorer window. A four-sided arrow is displayed when this function is selected. Move your pointer to any edge or corner of the TA Instrument Explorer window. When the four-sided arrow is displayed, hold down the left mouse button and drag the window border until the desired size is reached. Then release the mouse button.
Used to minimize the TA Instruments Explorer window to a button on the Task bar.
Used to open (maximize) the TA Instruments Explorer window so that it completely fills the available monitor space.
Used to close the TA Instrument Explorer window.
Used to hide the TA Instruments Explorer window from view. You must reopen the window by clicking the icon in the system tray to display it again.
Connect to Remote TA Message Agent (TAMA) (Q Series Instruments Only)
TA Message Agent (TAMA) is a Windows Service Program that operates behind-the-scenes to control various instrument functions. When you select Connect to Remote TA Message Agent (TAMA) from the menu a window is displayed to allow you to change to a remote TAMA.
When you select Show This Computer License from the menu, a window is displayed to allow you to view the user information, unit information, license information, and permissions associated with the computer.
When you select Show Version Information from the menu, a window is displayed to allow you to view the current versions of all of the software components.
Select this menu item to close and restart both the TA Instrument Explorer and the TA Message Agent (TAMA).
Locate instrument with default IP address (Q Series Instruments Only)
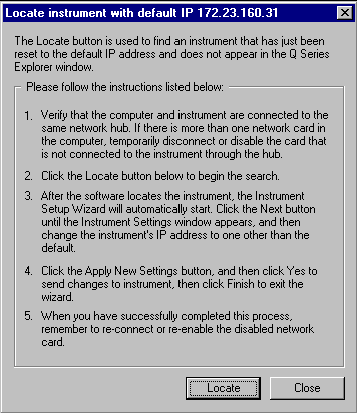
Select Locate instrument with default IP address to find an instrument that has just had its IP address reset to the default IP address 172.23.160.31 and does not appear in the TA Instrument Explorer. After choosing this menu item a window will be displayed containing instructions that you need to follow.

Select this menu item to display the version number for the TA Instrument Explorer and the controller identification number for the current controller computer.